

In this post, I’ll talk about what an efficient frontier portfolio is, and I’ll try to give you an intuitive feel of what it’s all about.
This post is meant to be more of a practical guide than mathematical theory. The reason’s because in this blog, we mostly care about making money and not masturbating to the theory/math.
After this post, you’ll hopefully:
- Get an intuitive feel for what the efficient frontier represents.
- What you should do with this information to maximize your profits.
Table Of Contents
Definition Of An Efficient Frontier Portfolio
An efficient frontier portfolio is a portfolio that’ll give you the most amount of return with the least amount of risk.
- “Returns” are quantified by historical average returns.
- Risk is quantified by historical standard deviation of returns.
Intuitively, things with high standard deviation is riskier because you don’t know if the asset will swing up or down. And if the asset swings up or down wildly, it’s more risky because you don’t know if you’ll be able to get your money back.
- For example, you might not want to have a return of 5% with a standard deviation of 20%. Assuming a normal distribution of returns, you’ll lose 65.5% of the time.
- But you might be OK with a return of 5% if the standard deviation was, say, 0%. This means you’d be guaranteed a 5% return each year.
Some Quick Bookkeeping: Sharpe Ratio Definition
To understand the efficient frontier better, let’s talk about the Sharpe Ratio. The reason why I wanted to take this brief detour is because the Sharpe Ratio is used a lot with efficient frontier, and with portfolio returns in general. If you’re looking to analyze portfolios, this term will come up a lot, so we might as well get the definition over with here.
The Sharpe Ratio is just (Return of a portfolio – Risk Free Return) / (Standard Deviation of a portfolio).
- Risk Free return is just a return you’d get with, say, short-term treasury bonds where your returns are guaranteed.
- Intuitively speaking, the Sharpe Ratio just represents how much extra return you’d get (over an alternative return which has no risk), divided by the risk of your portfolio. The higher the Sharpe Ratio is, the more ‘bang for your buck’ you get for the financial risk you’re taking.
The Efficient Frontier, In Practice
Imagine a graph where portfolios are represented by an x and a y axis, where:
- X-axis = risk / standard deviation.
- Y-axis = average returns.
Mathematically speaking, you can combine a bunch of portfolios in a certain way so that you’ll maximize your average returns for the minimum amount of risk.
You can create an “efficient portfolio” in many ways. This is because the higher returns you seek, the more risk you can absorb while keeping the Sharpe Ratio constant.
For example, portfolio A has double portfolio B’s (Return – Risk-Free Return), but also double portfolio B’s standard deviation, so their Sharpe Ratio is the same.
Thus, you can have many different combinations of portfolios that give you varying returns and varying risk, but end up with roughly the same Sharpe Ratio. These many different combinations of efficient portfolios is called the “efficient frontier.”
Shoving a bunch of portfolios together, an efficient frontier looks like this:
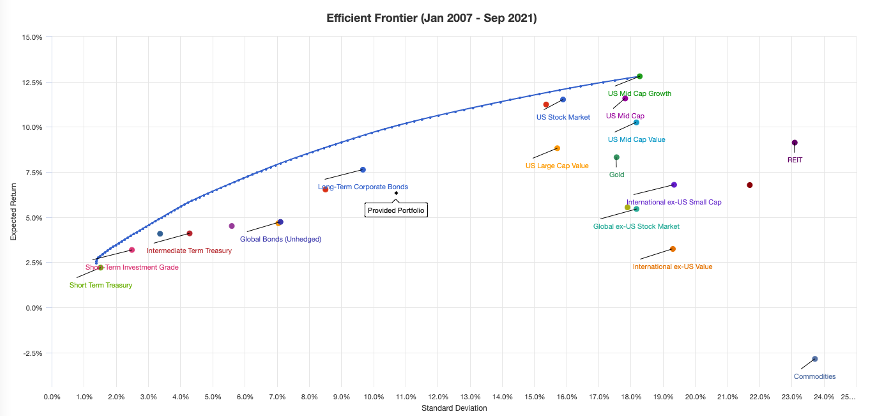
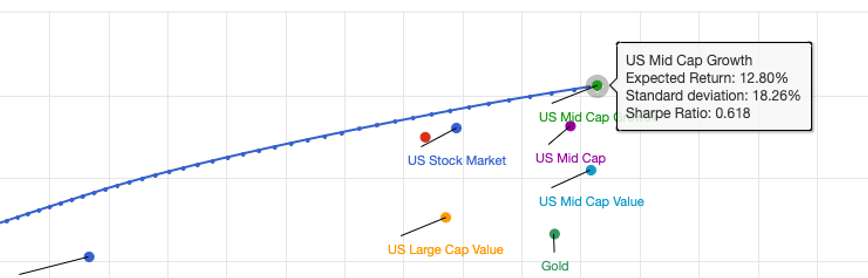
If I want a ton of returns, then I might just hover my mouse to where the blue curve (efficient frontier) is at its peak, which just recommends I put all my money in US Mid Cap Growth stocks.
If I wanted something that has the standard deviation of the stock market (i.e. much less risky), but slightly worse returns, I might highlight my mouse right on top of the US Stock Market:
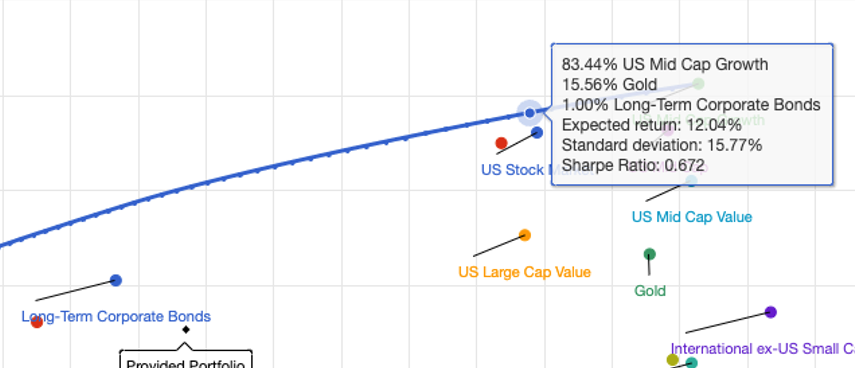
Note that the Sharpe Ratio of doing 83.44% Mid-Cap + 15.56% Gold + 1% Long-Term Corporate Bonds is higher than just doing all-in on Mid-Caps. This is intuitive because going all-in on mid-caps will give you more risk (+2.5% standard deviation), but for not much more return (an increase in .76%).
You can use the same tool as I did here to see what sorts of tickers or blend of portfolio works best for you.
The Intuition Behind All This
Let’s just ignore all the math and Sharpe Ratio for now. What can you glean from this whole thing?
There’s basically only 2 concepts all this boils down to:
- Given 2 portfolios with the same risk, you want to pick the one with a higher return.
- And given 2 portfolios with the same returns, you’d like to pick the portfolio with lower risk.
Essentially, per unit of risk you’re taking, you want to maximize your profits. Otherwise, you’re taking unnecessary risks.
Why Most Of This Efficient Frontier Math Is Garbage
I’d say it’s more important to understand the 2 concepts in the prior section than it is to understand the actual math behind Sharpe Ratio / efficient frontiers.
Here lies the reasons:
Using standard deviation as a term for risk assumes that portfolio returns are normally distributed. This assumption is very unlikely to be true across all portfolios. Thus, each portfolio an efficient frontier calculator includes will incorporate some inaccuracies into it.
In practice, a calculator will suck in a lot of portfolios, and those inaccuracies will compound. This means an efficient frontier portfolio that any calculator comes up with is probably wildly inaccurate.
And another thing that makes the math hard to trust is that past returns don’t indicate future results. Especially when you are looking across many different portfolio classes which change and evolve immensely over time. So even if you could use standard deviation as an accurate tool for risk (you can’t, because returns aren’t normally distributed) – past standard deviation of returns do not indicate future risk.
So the math is doubly-screwed.
What You Should Do With This Information
You’ll notice the “US Stock Market” just as a portfolio is pretty efficient.
The S&P 500 basically represents the US Stock Market.
Thus, you should just invest in the S&P 500.
S&P 500 should perform even better than “US Stock Market” because it’ll yield most of the profits from the US Stock Market, but exclude the volatility of small caps. This means in reality, the S&P 500 should have a lower volatility than the “US Stock Market” as indicated above (yet yield roughly the same returns).
You may be tempted to maximize your gains by investing 100% in US Mid Cap Growth. While that portfolio does have slightly more returns, it also has a lot more volatility (risk). For that reason, I don’t recommend doing mid caps unless you’re planning on holding if for a very long time where the average returns will win out and the standard deviation of returns won’t matter.
But even then, you’re taking a lot more risk over a long period of time just to get an average of <1% more profits per year. By the rule of 72, even if you took a lot more extra risk for 72 years, you still wouldn’t double your returns when compared to S&P 500.
Wrapping It Up
An efficient frontier portfolio can be complicated due to a lot of math.
Luckily, this “classroom math” for efficient frontiers don’t reflect reality. Most portfolios won’t follow a normal curve distribution. Hence, shoving all of them together to create an efficient frontier might yield nonsensical results.
Instead, the concept of the Sharpe Ratio and efficient frontier should just be used as a guide on how to build your portfolio. That is, you should take the least amount of risk as possible for the highest amount of return.
Just looking at the above screenshots, it turns out you can be quite efficient by just investing in the S&P 500.
The more time you have and the less liquidity you need, the more you might care about the “average returns” over the risk. This is because the average wins out over time, and any given year of bad gains will be amortized out in the long-run.
Conversely, if you need liquidity (because you’re getting ready to retire soon), then you’ll probably want to go with a portfolio with much lower risk. This is because you might not have another 50 years to wait for a portfolio’s “average returns” to save you.


0 Comments
Trackbacks/Pingbacks